
First Project: Mapping crime
Uses R, and R Markdown
Using R, I extracted recorded crime data for Northern Ireland from data.police.uk and produced an interactive map. The code is available here.

"The world cannot be understood without numbers. But the world cannot be understood with numbers alone."
Hans Rosling

I want to help others make the right, data-driven decisions.
For the last 15 years I have been involved in data analysis in the public sector. This has ranged from providing statistical analysis and management information dashboards to help identify and respond to emerging problems, all the way through to operational analysis working on high intensity, high complexity investigations tackling serious and organised crime.
My experience has equipped me with the skills for the full data analysis process: retrieval & pre-processing, cleansing, applying statistical methods, visualisation and communication.
Most of my technical and software experience is with MS Excel (including VBA and powerquery), but I also dabble with R, Python, SQL, Power BI and Tableau.
I can also bring a wide range of soft skills to the table including: Teamwork, Leadership, Systems Thinking, Communication, Decision Making and a strong Work Ethic.
Below are a few examples of some projects I have worked on in the past, presented chronologically.
Using R, I extracted recorded crime data for Northern Ireland from data.police.uk and produced an interactive map. The code is available here.
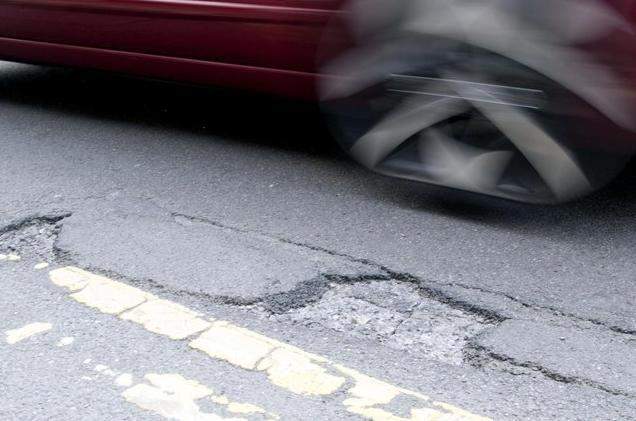
Using a similar method, I was able to map reports of potholes using data from Open Data NI.
This project involved much more data cleansing of the Shapefile, including reprojecting the data to EPSG:4326 and removing null values, which was achieved in QGIS.
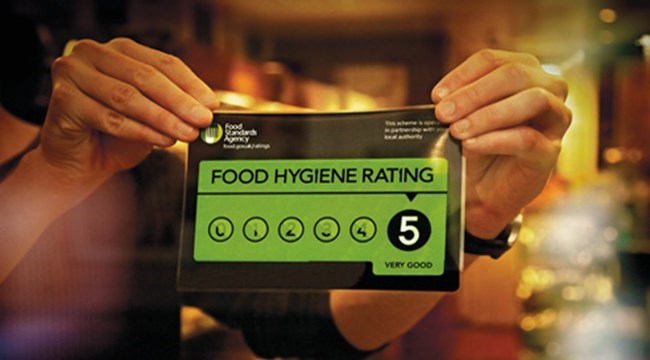
In this project I built an information dashboard using data from the "Belfast Food Premise Hygiene Ratings" dataset. The dashboard shows the data, makes it available to download, charts the distibution of hygiene ratings and maps the restaurant locations.